Guru example
from modelgym import Guru
import numpy as np
Initialize Guru
guru = Guru()
Make toy dataset
n = 100
np.random.seed(0)
X = np.zeros((n, 6), dtype=object)

# make not numeric feature
X[:, 0] = 'not a number'

# make categorial feature
X[:, 1] = np.random.binomial(3, 0.6, size=n)

# make sparse feature
X[:, 2] = np.random.binomial(1, 0.05, size=n) * np.random.normal(size=n)

# make correlated features
X[:, 3] = np.random.normal(size=n)
X[:, 4] = X[:, 3] * 50 - 100

# make independent feature
X[:, 5] = np.random.normal(size=n)

# make disbalanced classes
y = np.random.binomial(3, 0.9, size=n)
Main features
Looking for categorical features
guru.check_categorial(X)
Some features are supposed to be categorial. Make sure that all categorial features are in cat_cols.
Following features are not numeric:  [0]
Following features are not variable:  [1]
defaultdict(list, {'not numeric': [0], 'not variable': [1]})
Looking for sparse features
guru.check_sparse(X)
Consider use hashing trick for your sparse features, if you haven't already. Following features are supposed to be sparse: [2]
[2]
Looking for correlated features
guru.check_correlation(X, [3, 4, 5])
There are several correlated features. Consider dimention reduction, for example you can use PCA. Following pairs of features are supposed to be correlated: [(3, 4)]
[(3, 4)]
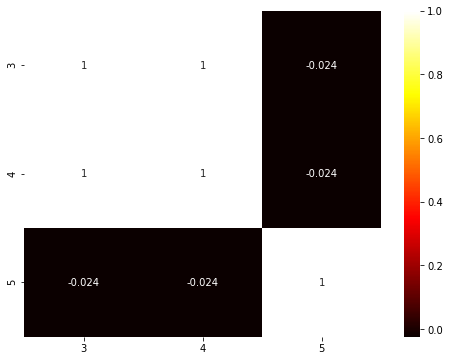
Drawing correlation heatmap for features
guru.draw_correlation_heatmap(X, [3, 4, 5], figsize=(8, 6))
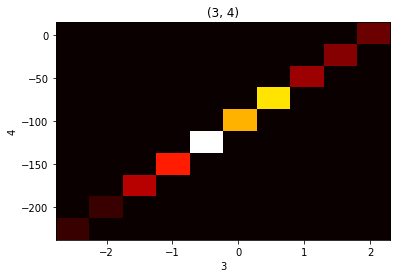
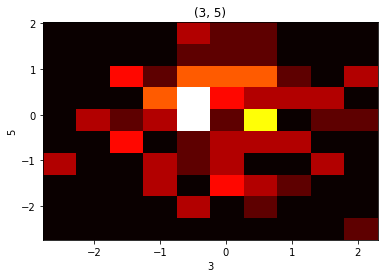
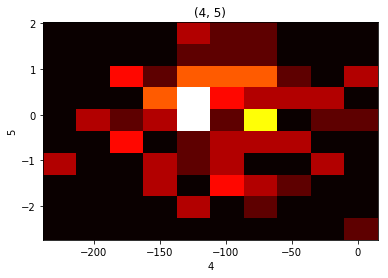
Drawing 2d histograms for features
guru.draw_2dhist(X, [3, 4, 5])
Looking for disbalanced classes
guru.check_class_disbalance(y)
There is class disbalance. Probably, you can solve it by data augmentation.
Following classes are too common:  [3]
Following classes are too rare:  [1, 0]
defaultdict(list, {'too common': [3], 'too rare': [1, 0]})
dtype with fields
You can also use array with dtype with fields
Let’s make another representation of the same data
named_X = np.zeros((n,), dtype=[('str', 'U25'),
                                ('categorial', 'int'),
                                ('sparse', float),
                                ('corr_1', float),
                                ('corr_2', float),
                                ('independent', float)])
for i, name in enumerate(named_X.dtype.names):
    named_X[name] = X[:, i]
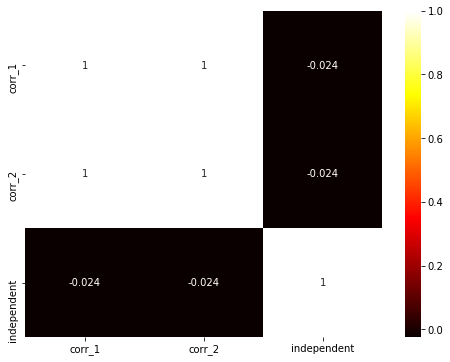
Now we can draw heatmap like this
guru.draw_correlation_heatmap(named_X, ['corr_1', 'corr_2', 'independent'], figsize=(8, 6))